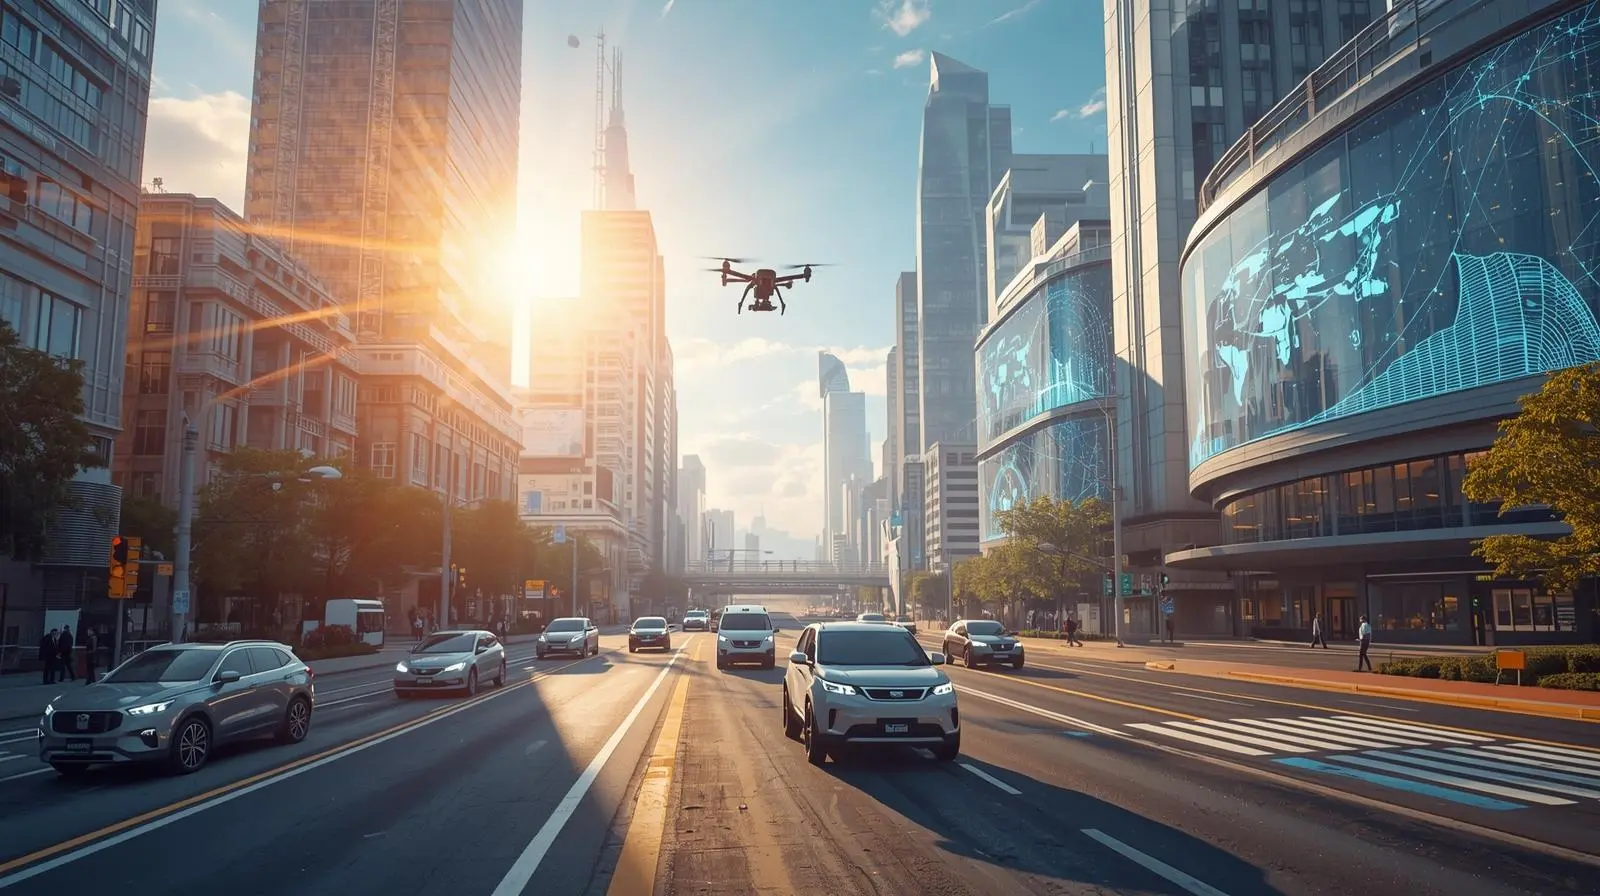
🚗 AI is reshaping how cities move, breathe, and function — from self-driving vehicles and intelligent traffic systems to predictive infrastructure maintenance and AI-optimized public transit. This 2026 guide covers every major AI application transforming transportation and smart cities — with real results, leading technologies, and the governance guardrails that protect citizens when AI controls the infrastructure they depend on.
Last Updated: May 5, 2026
Cities are the most complex systems humans have ever built — continuously managing millions of simultaneous decisions about how people and goods move, how infrastructure is maintained, how energy is distributed, how public safety is managed, and how services are delivered to populations that are simultaneously diverse, demanding, and growing. For most of urban history, these decisions have been managed through a combination of physical infrastructure, human judgment, and relatively simple rule-based systems. The result has been cities that work — but with chronic inefficiencies, persistent inequities, and regular failures that impose enormous costs in time, money, environmental impact, and human safety.
AI is beginning to change this equation — not by replacing the physical infrastructure of cities but by adding an intelligence layer that makes existing infrastructure significantly more efficient, more responsive, and more equitable. Traffic signals that adapt in real time to actual traffic patterns rather than fixed timing cycles. Public transit systems that adjust service frequency based on predicted demand. Infrastructure maintenance programs that identify developing failures weeks before they occur rather than repairing them after they fail. Emergency response systems that optimize vehicle routing dynamically as situations evolve. These are not future possibilities — they are operational realities in leading cities globally in 2026.
According to McKinsey’s research on smart cities, AI-powered urban intelligence applications could reduce commute times by 15–20%, lower traffic fatalities by 30–40%, cut infrastructure maintenance costs by 25%, and reduce urban energy consumption by 10–15% in cities that deploy these capabilities comprehensively. At the scale of major metropolitan areas — where these percentages translate to hundreds of millions of hours, thousands of lives, and billions of dollars — the stakes of smart city AI are extraordinary.
This guide provides a comprehensive examination of AI in transportation and smart cities — covering autonomous vehicles, traffic management, public transit, urban planning, infrastructure maintenance, and public safety. It addresses the real-world results leading cities and transportation operators are achieving, the specific technologies enabling those results, and the governance frameworks and equity guardrails that must ensure AI-powered urban systems serve all citizens — not just the technologically and economically privileged.
📖 New to AI terminology? Visit the AI Buzz AI Glossary — 65+ essential AI terms explained in plain English, each linking to a full in-depth guide.
1. 📊 The State of AI in Transportation and Smart Cities in 2026
The smart city concept has been discussed for more than a decade — but 2026 represents the first point at which AI-powered urban intelligence has moved from pilot projects and demonstration installations to genuine operational infrastructure in a significant number of cities globally. The convergence of mature AI capability, ubiquitous IoT sensor networks, high- bandwidth urban connectivity, and the policy frameworks that enable AI deployment in public infrastructure has created conditions for scaled smart city implementation that previous generations of the technology lacked.
The Maturity Shift: The difference between smart city AI in 2019 and smart city AI in 2026 is the difference between laboratory demonstrations and operational infrastructure. Traffic management AI that previously ran in parallel with human-controlled signal systems as a monitoring tool now controls traffic signals in hundreds of cities globally. Predictive maintenance AI that previously generated reports for human engineers to act on now automatically dispatches maintenance teams and orders parts. This maturity shift — from advisory to operational — is what transforms smart city technology from interesting to consequential.
According to Deloitte’s Smart Cities 2026 research, 68% of cities with populations above 500,000 have deployed at least one AI-powered traffic management system, 54% use AI in public transit optimization, and 41% have implemented AI-assisted infrastructure maintenance programs. The adoption gap between large cities with sophisticated technology governance and smaller cities with limited AI procurement capability remains significant — but cloud-based smart city platforms are beginning to extend access to AI- powered urban intelligence to municipalities that could not previously afford bespoke smart city implementations.
| AI Application | Core Capability | Reported Impact in 2026 |
|---|---|---|
| Adaptive Traffic Management | Real-time signal optimization based on actual traffic flow and demand | 15–25% reduction in average commute times in deployed cities |
| Autonomous Vehicles | AI-powered perception, planning, and control for driverless operation | Level 4 autonomy commercially deployed in multiple US cities |
| Public Transit AI | Demand prediction and dynamic service frequency optimization | 20–30% improvement in on-time performance with reduced operating costs |
| Infrastructure Maintenance AI | Sensor-based predictive failure detection for roads, bridges, and utilities | 30–45% reduction in emergency repair costs and unplanned infrastructure failures |
| Emergency Response AI | Dynamic routing and resource allocation for emergency vehicles | 15–25% reduction in emergency response times |
| Urban Planning AI | Simulation and optimization of urban development scenarios | 40–60% reduction in planning modeling time with improved outcome prediction |
2. 🚗 Autonomous Vehicles: From Pilot to Operation
Autonomous vehicles are the transportation AI application that has received the most sustained public attention — and the one whose commercial reality in 2026 differs most significantly from the predictions made about it five years ago. Full Level 5 autonomy — vehicles that can operate in any conditions, anywhere, without any human capability to take over — remains further from commercial deployment than 2021 predictions suggested. But Level 4 autonomy — vehicles that operate fully autonomously within specific, well-defined operational domains — has become commercial reality in multiple markets.
The Commercial Autonomous Vehicle Landscape in 2026
- Waymo: Operates fully autonomous robotaxi services (without safety drivers) in Phoenix, San Francisco, and Los Angeles — with tens of millions of fully autonomous miles accumulated and a safety record that is being closely watched by regulators globally. Waymo’s operational experience represents the most comprehensive real-world validation of Level 4 autonomous driving in passenger transport contexts.
- Aurora and Kodiak Robotics: Autonomous long-haul freight operations on defined interstate corridors in Texas and adjacent states — addressing the chronic driver shortage in the freight industry while demonstrating the commercial viability of autonomous trucking on well-mapped, predictable highway routes.
- Nuro: Autonomous delivery vehicles operating in suburban environments — purpose-built for goods delivery rather than passenger transport, with smaller form factors and lower speed envelopes that reduce the safety complexity of full-speed passenger vehicle autonomy.
- Autonomous Mining and Industrial: The most mature commercial autonomous vehicle deployments are in controlled industrial environments — mining haul trucks from Caterpillar and Komatsu, port logistics vehicles, and airport ground support equipment — where the operational domain is defined and the infrastructure is purpose-built for autonomous operation.
What the Technology Stack Looks Like
A modern autonomous vehicle integrates multiple AI systems simultaneously — each addressing a different aspect of the perception, prediction, and planning problem that autonomous driving requires:
- Multi-Modal Sensor Fusion: Cameras (typically 8–12 providing 360-degree visual coverage), LiDAR (generating real-time 3D maps of the surrounding environment), radar (detecting objects and velocities in adverse weather), and ultrasonic sensors — with AI fusion algorithms combining these data streams into a unified environmental model that is more reliable than any single sensor modality
- Prediction Models: AI models that predict the future behavior of all detected road users — pedestrians, cyclists, other vehicles, animals — over a planning horizon of several seconds, enabling proactive rather than reactive vehicle control
- Motion Planning: AI systems that generate a vehicle trajectory achieving navigation objectives while respecting traffic rules, maintaining passenger comfort, and handling the infinite variety of real-world driving scenarios at real-world speeds
For the complete analysis of autonomous vehicle AI and its safety requirements, see our guide on Physical AI Explained: How Robots, Drones, and Smart Machines Use AI.
3. 🚦 AI Traffic Management: The Intelligent Signal
Traffic signal management is one of the most impactful and most immediately deployable smart city AI applications — delivering measurable commute time reductions, emissions improvements, and public safety benefits in cities that have made the transition from fixed-cycle or simple actuated signals to AI-adaptive systems.
How AI Traffic Management Works
Traditional traffic signals operate on fixed timing cycles — a sequence of green, amber, and red phases repeated at predetermined intervals regardless of actual traffic conditions. Actuated signals respond to vehicle detection at intersections but typically adjust only the duration of a fixed cycle rather than the overall signal coordination strategy. AI adaptive traffic management does something fundamentally different — it continuously optimizes signal timing across an entire network of intersections simultaneously, treating the traffic network as a system rather than as a collection of independent intersections.
AI traffic management systems process data from:
- Loop detectors and video cameras at intersections providing real-time vehicle count and speed data
- Connected vehicle data from vehicles equipped with V2I (Vehicle-to-Infrastructure) communication
- GPS trace data from navigation applications providing network-wide travel time and route choice information
- Historical traffic pattern databases providing the baseline against which current conditions are compared
- Event calendars, weather data, and incident information affecting predicted traffic patterns
Real-World Results
The commercial AI traffic management systems that have seen the widest deployment include Siemens’ SCOOT, Google’s Green Light program, and NoTraffic’s AI platform — all of which have accumulated significant operational evidence of their impact:
- Pittsburgh’s deployment of Surtrac AI traffic management reduced travel times by 25% and idling time by 40% at equipped intersections — while simultaneously reducing vehicle emissions by approximately 20% through smoother traffic flow
- Google’s Green Light program — which provides AI signal timing recommendations to traffic engineers in cities globally — has reported 10–20% reductions in stops and 10% reductions in intersection emissions in participating cities including Jakarta, Rio de Janeiro, and Seattle
- Cities implementing network-wide AI traffic management consistently report 15–25% reductions in average commute times and measurable improvements in air quality along major corridors
Emergency Vehicle Preemption
A particularly high-value AI traffic management application is emergency vehicle preemption — where AI systems coordinate green waves for approaching emergency vehicles across multiple intersections simultaneously, clearing a path through traffic ahead of the vehicle rather than simply preempting the single intersection the vehicle is approaching. This AI- coordinated approach reduces emergency response times by 15–25% in cities where it is deployed — a reduction that directly correlates with improved outcomes in cardiac and trauma emergencies.
4. 🚌 AI in Public Transit: Smarter Buses and Trains
Public transit systems are extraordinarily complex operational environments — simultaneously managing vehicle fleets, crew scheduling, passenger demand, infrastructure maintenance, and real-time service disruptions across networks that span dozens to hundreds of routes serving millions of daily passengers. AI is transforming transit operations across multiple dimensions simultaneously.
Demand Prediction and Dynamic Service Optimization
AI demand prediction systems analyze historical ridership data, real-time passenger counts, weather, events, and behavioral signals to forecast passenger demand across the transit network at high spatial and temporal resolution. This demand intelligence enables transit operators to dynamically adjust service frequency — increasing bus or train frequency on routes and at times where demand is highest, and reducing frequency during low-demand periods — optimizing both service quality for passengers and operational cost efficiency for transit agencies.
Transit agencies deploying AI demand management consistently report improvements in on-time performance, reduced bus bunching (where buses on the same route arrive simultaneously rather than evenly spaced), and measurable improvements in passenger satisfaction — while simultaneously reducing operating costs per passenger trip through more efficient resource allocation.
Autonomous and Semi-Autonomous Transit Vehicles
Several cities in Europe and Asia have deployed autonomous bus and tram services on defined routes with controlled environments — representing a more tractable autonomous vehicle application than general mixed-traffic operation. Singapore’s autonomous bus trials, the autonomous tram networks in several European cities, and autonomous shuttle services in controlled campus and airport environments demonstrate the commercial viability of transit autonomy in appropriate operational contexts.
Predictive Maintenance for Transit Fleets
Transit vehicle fleets are enormous capital assets whose reliability directly determines service quality. AI predictive maintenance systems analyze sensor data from buses, trains, and trams to identify developing mechanical issues before they cause in-service failures — enabling scheduled maintenance interventions that prevent the service disruptions that unplanned breakdowns create. Transit agencies implementing AI fleet maintenance report significant reductions in mean time between failures, lower emergency repair costs, and measurable improvements in fleet reliability that directly improve passenger experience.
🏭 Exploring AI in your industry? Browse the AI Buzz Industry Guide — 35+ in-depth sector guides covering how AI is transforming healthcare, finance, HR, legal, retail, manufacturing, and more.
5. 🌆 Smart City Infrastructure: AI for Urban Systems
Beyond transportation, AI is being deployed across the full spectrum of urban infrastructure — enabling cities to manage their physical assets, energy systems, and public services more efficiently, more sustainably, and more responsively to citizen needs.
Predictive Infrastructure Maintenance
Urban infrastructure — roads, bridges, water mains, sewers, street lighting, and public buildings — degrades continuously and requires maintenance that, when reactive, is far more expensive and disruptive than equivalent planned maintenance. AI predictive maintenance for urban infrastructure mirrors the applications covered in our guides on AI in Manufacturing and AI in Energy and Utilities — with sensor networks monitoring structural health, vibration, acoustic signatures, and material properties to identify developing issues before they become failures.
Key infrastructure AI maintenance applications include:
- Pavement Condition Assessment: AI analysis of vehicle-mounted sensor data, smartphone accelerometer data, and satellite imagery to map road surface condition at network scale — enabling maintenance prioritization based on actual condition rather than scheduled inspection cycles
- Bridge Structural Monitoring: Sensor networks embedded in bridge structures that continuously monitor strain, vibration, and movement — with AI analysis identifying the early signatures of structural deterioration that visual inspection cannot detect
- Water Network Leak Detection: Acoustic sensor networks in water distribution systems that detect the acoustic signatures of developing leaks — enabling location and repair before significant water loss or surface failure occurs
- Street Light Management: AI systems that monitor individual streetlight performance and predict failures — enabling proactive replacement that maintains public safety and reduces emergency maintenance callouts
Smart Energy Management
Cities are significant energy consumers — with street lighting, public buildings, transit systems, and urban water management collectively representing major energy expenditure. AI building management and urban energy optimization systems reduce city energy consumption through real-time optimization of HVAC, lighting, and operational scheduling — with cities implementing comprehensive AI energy management reporting 15–25% reductions in municipal energy consumption and commensurate reductions in both cost and carbon emissions.
This connects directly to the applications covered in our guide on AI and the Environment: How Technology Can Help Combat Climate Change.
AI-Powered Urban Planning
Urban planning — the long-term management of land use, development, transportation infrastructure, and public services to shape the physical form of cities — is being transformed by AI simulation and optimization tools that enable planners to model the impacts of development decisions at a scale and speed impossible with conventional methods.
AI urban planning tools enable:
- Simulation of traffic, air quality, noise, and land value impacts of proposed development scenarios before planning decisions are made
- Optimization of public transit network design to maximize accessibility for all city residents — including equity analysis of how different network designs affect underserved communities
- Identification of development sites and land uses that maximize economic activity, environmental sustainability, and social equity simultaneously
- Processing of public consultation responses at scale — enabling genuine engagement with the views of all citizens rather than only those with the time and literacy to navigate traditional consultation processes
6. 🚨 AI for Public Safety and Emergency Response
AI applications in public safety represent some of the most consequential — and most contested — smart city deployments. The potential to save lives through faster emergency response, better crime prevention, and more effective disaster management is genuine. The risk of creating surveillance infrastructure that undermines civil liberties, perpetuates racial bias in policing, and erodes the privacy rights that democratic societies protect is equally genuine. This duality demands the most rigorous governance of any smart city AI application.
Emergency Dispatch and Response Optimization
AI dispatch systems that optimize the assignment and routing of emergency vehicles in real time — accounting for current traffic conditions, the locations of all available units, the severity of the incident, and the predicted travel time from each unit to the incident — represent one of the clearest cases of AI benefit in public safety. These systems are not replacing human dispatch judgment — they are providing dispatchers with real-time optimization support that human dispatchers cannot perform manually at the required speed and complexity.
Cities deploying AI-assisted dispatch consistently report 15–25% reductions in response times — with direct implications for outcomes in cardiac, trauma, and fire emergencies where every minute of reduced response time demonstrably improves survival rates.
Predictive Infrastructure Safety
AI systems that predict infrastructure safety failures — bridge structural issues, building code violations, sinkhole risk from underground pipe failures — before they create emergency situations represent a particularly high-value public safety application. These systems address safety risks proactively rather than reactively, without the civil liberties implications of behavioral surveillance or predictive policing.
Disaster Response and Recovery
AI is transforming disaster management — from early warning systems that detect developing natural disasters earlier than conventional monitoring to damage assessment systems that process satellite imagery of disaster- affected areas to guide emergency response resource allocation. For the complete analysis of AI in crisis management, see our guide on AI in Crisis Management and Humanitarian Aid.
7. 🌱 Sustainability and Environmental AI in Cities
Cities account for approximately 70% of global energy consumption and a comparable share of greenhouse gas emissions — making urban AI applications for sustainability among the highest-impact environmental interventions available. The convergence of smart city infrastructure and sustainability objectives is creating genuine opportunities to reduce urban environmental impact while improving quality of life for city residents.
Air Quality Monitoring and Management
AI air quality systems integrate data from sensor networks, traffic management systems, industrial emission sources, and weather data to generate real-time air quality maps of cities at street-level resolution — and to predict air quality conditions hours in advance. This intelligence enables both individual citizen decisions (routing active commuters away from high- pollution corridors) and policy interventions (dynamic traffic management that reduces vehicle idling in air-quality-sensitive areas).
Urban Heat Island Mitigation
AI analysis of urban surface temperature data from satellite and ground sensors — combined with urban morphology, vegetation cover, and population density data — enables city planners to identify urban heat island hotspots and design targeted mitigation interventions (tree planting, cool roof programs, reflective pavement) that address the highest-priority locations rather than applying uniform interventions regardless of local conditions.
Waste Management Optimization
AI-optimized waste collection systems use sensor data from smart bins, route optimization algorithms, and demand forecasting to generate collection schedules that minimize collection vehicle miles — reducing both operating costs and emissions — while ensuring that high-use collection points are emptied before overflow occurs. Cities implementing AI waste management report 20–30% reductions in collection vehicle miles and measurable improvements in collection reliability.
8. 🛡️ The Essential Guardrails for AI in Transportation and Smart Cities
Smart city AI operates at the intersection of public infrastructure, citizen safety, and democratic governance — making the governance requirements for these systems among the most demanding of any AI deployment context. The following guardrails represent the minimum standards for responsible smart city AI deployment.
Guardrail 1: Safety as the Non-Negotiable Primary Objective
Every AI system that controls or influences transportation infrastructure must be designed with safety as the primary, non-negotiable objective — not efficiency, not cost reduction, not convenience. An AI traffic management system that improves throughput but increases accident rates has failed regardless of its efficiency metrics. An autonomous vehicle system that reduces travel times but produces more severe collision outcomes than human drivers has failed regardless of its convenience benefits.
Safety-first design requires fail-safe architecture — systems that default to safe states when they encounter conditions outside their validated operational domain, rather than attempting to continue operating on uncertain ground. This connects to the Physical AI safety framework — where operational design domain definition and fail-safe design are foundational requirements.
Guardrail 2: Equity by Design — Not as an Afterthought
Smart city AI systems that optimize for aggregate efficiency can systematically disadvantage the populations that most need transportation improvement — low-income communities, communities of color, residents with disabilities, and elderly residents who depend most heavily on public transit and pedestrian infrastructure. An AI traffic management system that reduces commute times for automobile commuters while degrading pedestrian crossing times to maximize vehicle throughput has optimized for the wrong objective.
Equity analysis must be built into the design of smart city AI systems — evaluating how different system configurations distribute benefits and costs across different population groups, and requiring that systems demonstrate equitable service across all communities rather than aggregate efficiency metrics that may obscure distributional inequity.
Guardrail 3: Democratic Accountability and Transparency
Citizens have the right to know when and how AI systems are managing the public infrastructure they depend on — and to have meaningful input into the values and objectives those systems optimize for. Smart city AI governance must include public disclosure of AI system deployments, transparent communication about how systems work and what they optimize for, and genuine mechanisms for public input into smart city AI objectives and priorities.
This connects to the broader framework in our guide on AI in Government and Public Services — where democratic accountability and algorithmic transparency are foundational requirements for AI in public sector contexts.
Guardrail 4: Strict Boundaries on Surveillance
Smart city sensor infrastructure — cameras, license plate readers, Bluetooth and Wi-Fi tracking systems — creates the technical capability for pervasive citizen surveillance that extends far beyond what is necessary or appropriate for transportation management. Clear, legally enforceable boundaries must define what data smart city systems can collect, how long it can be retained, who can access it, and what purposes it can be used for — with strict prohibition on mission creep that repurposes transportation data for law enforcement, immigration enforcement, or commercial purposes without explicit public consent.
The data governance principles covered in our guide on AI and Data Privacy apply with particular force in smart city contexts — where the data being collected describes citizens’ movements, behaviors, and patterns of life in public spaces where they have reasonable expectations of privacy despite the technical public nature of those spaces.
Guardrail 5: Cybersecurity for Critical Infrastructure
Smart city transportation infrastructure connected to networks creates cybersecurity attack surfaces where a successful compromise can have immediate physical consequences — traffic management systems that could be manipulated to cause accidents, transit systems that could be disrupted, or emergency response systems that could be degraded precisely when they are most needed. The NIST Cyber AI Profile controls for AI system security must be applied with particular rigor to smart city infrastructure — because the physical consequences of successful attacks are categorically more severe than the data compromise consequences of equivalent attacks on commercial AI systems.
Guardrail 6: Human Override and Operational Control
Every AI system managing critical transportation or urban infrastructure must provide human operators with clear, accessible, reliable override capability — the ability to monitor AI behavior, intervene when AI decisions appear incorrect or inappropriate, and disable AI control and revert to human operation when circumstances require. The Human-in-the-Loop principle is non-negotiable for systems where AI errors can have immediate safety consequences — and must be implemented as a hardware-level capability rather than a software feature that a malfunctioning AI system might itself disable.
🏁 Conclusion: The City That Learns
The vision of the truly smart city — one where AI continuously learns from the behavior of millions of citizens, continuously optimizes the systems that serve them, and continuously adapts to changing conditions and emerging needs — is genuinely inspiring. It promises cities that are safer, more efficient, more sustainable, and more equitable than the cities built before AI existed.
Realizing that vision requires getting the governance right alongside the technology. A smart city whose AI systems optimize for the convenience of car owners at the expense of transit riders is not delivering on the promise. A smart city whose sensor infrastructure enables pervasive citizen surveillance is not delivering on the promise. A smart city whose AI systems work well in wealthy neighborhoods and poorly in underserved ones is not delivering on the promise.
The cities that will define the standard of smart city AI in 2026 and beyond are those that treat equity, safety, transparency, and democratic accountability not as constraints on their smart city ambitions but as the foundational requirements that make smart city AI worthy of the public trust it depends on. Technology that serves all citizens equally — that makes the city safer, faster, cleaner, and fairer for everyone who lives in it — is what smart city AI is for.
📌 Key Takeaways
| ✅ | Takeaway |
|---|---|
| ✅ | AI-powered urban intelligence could reduce commute times by 15–20%, lower traffic fatalities by 30–40%, cut infrastructure maintenance costs by 25%, and reduce urban energy consumption by 10–15%. |
| ✅ | Level 4 autonomous vehicle operations — without safety drivers — are commercially deployed by Waymo in multiple US cities, representing the most significant real-world validation of autonomous driving in public passenger transport. |
| ✅ | AI adaptive traffic management reduces commute times by 15–25% and vehicle emissions by 10–20% in deployed cities — Google’s Green Light program has demonstrated these results across multiple global cities. |
| ✅ | 68% of cities with populations above 500,000 have deployed at least one AI-powered traffic management system in 2026 — smart city AI has moved from pilots to operational infrastructure. |
| ✅ | AI emergency dispatch systems reduce response times by 15–25% — with direct impact on survival rates in cardiac, trauma, and fire emergencies where every minute matters. |
| ✅ | Equity by design — not as an afterthought — is the most critical governance requirement for smart city AI. Systems that optimize aggregate efficiency while ignoring distributional impact systematically disadvantage the most vulnerable city residents. |
| ✅ | Smart city sensor infrastructure creates surveillance capability that requires strict, legally enforceable boundaries on data collection, retention, access, and permitted uses — with explicit prohibition on mission creep to law enforcement or commercial purposes. |
| ✅ | Human override capability for every AI system managing critical transportation infrastructure must be implemented at the hardware level — not as a software feature that a malfunctioning AI could disable. |
🔗 Related Articles
- 📖 Physical AI Explained: How Robots, Drones, and Smart Machines Use AI
- 📖 AI in Government and Public Services: Improving Service Delivery and Citizen Support
- 📖 AI and the Environment: How Technology Can Help Combat Climate Change
- 📖 AI in Crisis Management and Humanitarian Aid: Saving Lives with Predictive Response
- 📖 Edge AI Explained: How AI Works Without the Internet
❓ Frequently Asked Questions: AI in Transportation and Smart Cities
1. How does AI adaptive traffic management actually know when to change signals — and how is it different from what cities use today?
Most traffic signals today operate on fixed timing cycles or simple actuated systems that detect vehicles at individual intersections and adjust the duration of predetermined phases. AI adaptive systems are fundamentally different — they optimize signal timing across entire networks of intersections simultaneously, treating the traffic system as an interconnected whole rather than a collection of independent signals. They process real-time data from multiple sources (loop detectors, cameras, GPS traces from navigation apps, connected vehicles) and continuously recalculate optimal signal timing across the network every few seconds. The result is signal coordination that responds to actual traffic conditions rather than average historical patterns.
2. Are autonomous vehicles actually safer than human drivers — and how do we know?
The safety comparison is complex and context-dependent. In the operational domains where Level 4 autonomous vehicles are deployed — well-mapped urban areas with relatively predictable traffic conditions — the available data suggests they are performing at or better than average human driver safety standards. Waymo has publicly reported significantly lower collision rates than human drivers in comparable conditions across their deployed fleet. However, comparing autonomous vehicle safety to human driver safety is challenging because autonomous vehicles are typically deployed in easier-than-average driving conditions, and because the data for truly comparable exposures is still accumulating. The honest answer is: in their current operational domains, deployed systems appear safer — but full comparability across all driving conditions remains an open question.
3. Do smart city AI systems create privacy risks for citizens — and what protections exist?
Yes — smart city sensor infrastructure creates genuine privacy risks that require active governance rather than passive acceptance. License plate readers, camera networks, and Bluetooth/Wi-Fi tracking systems collect data that can reconstruct individuals’ movements, behaviors, and patterns of life in public spaces. The protections available vary significantly by jurisdiction: the EU’s GDPR applies to smart city data collection, requiring legal basis for processing and limiting retention. Several US cities have passed specific smart city data governance ordinances restricting how collected data can be used and retained. The most important protection is public awareness — citizens who understand what data smart city systems collect and how it is used are better positioned to advocate for appropriate governance through democratic processes.
4. Why has fully autonomous driving (Level 5) taken longer than predicted — and when will it arrive?
The core challenge is the “long tail” problem — autonomous vehicles perform well across the vast majority of driving scenarios they encounter, but the rare, unexpected, edge-case scenarios that cause failures are extraordinarily difficult to eliminate completely. These scenarios — a child chasing a ball into the street between parked cars, a mattress falling off a truck on the highway, a traffic officer using non-standard hand signals — are too rare to be well-represented in training data but too consequential to ignore. Level 4 solves this by restricting autonomous operation to domains where these scenarios are less likely or where the vehicle can safely stop and request human assistance. Level 5 requires handling all scenarios without exception — a significantly harder problem. Most credible industry analysts now project Level 5 commercial deployment as a decade-plus horizon rather than the five-year predictions made in 2019-2021.
5. How do smart city AI systems handle cybersecurity — and what happens if they are hacked?
Smart city transportation AI systems controlling signal timing, transit operations, or emergency dispatch are classified as critical infrastructure in most jurisdictions — with cybersecurity requirements that reflect the severity of the consequences of a successful attack. Best practice includes network segmentation (operational technology networks controlling physical infrastructure isolated from IT networks), multi-layer authentication for all access to control systems, anomaly detection monitoring for unexpected system behavior, and manual override systems that allow human operators to take control when automated systems behave unexpectedly. See our NIST Cyber AI Profile guide for the comprehensive security framework. The consequences of a successful attack on traffic management or emergency dispatch infrastructure could be severe — making investment in cybersecurity for smart city AI a public safety priority, not just an IT concern.
6. How can smaller cities without large technology budgets access smart city AI capabilities?
The accessibility of smart city AI has improved significantly in 2026 through three mechanisms: cloud-based smart city platforms (where cities access AI-powered traffic management and infrastructure monitoring as a service rather than building custom systems), open-source smart city software (platforms like CityGML and OpenTrafficLab that provide foundational smart city capabilities without proprietary vendor lock-in), and regional consortium models (where groups of smaller municipalities collectively procure smart city AI infrastructure and share both costs and operational expertise). The McKinsey Global Institute and Bloomberg Philanthropies have both published frameworks for smart city AI deployment that are specifically designed for mid-sized and smaller municipalities — recognizing that the smart city opportunity should not be exclusive to the largest and wealthiest urban areas.
📧 Get the AI Buzz Weekly Digest
Weekly AI insights, tools, and strategies — delivered every Monday. Free.


Leave a Reply